Colors of Pi
A visualization of Pi
April 2015
The first version of Colors of Pi was born from a simple curiosity: what would it look like if we treated the infinite digits of Pi as a visual palette? I wanted to see if there were any hidden patterns or “colors” that emerged from the mathematical constant.
Technical Beginnings
The initial version of this site was created using a relatively straightforward Python script. The script would parse a large text file containing the first few thousand digits of Pi. For every six digits, it would generate a hexadecimal color code (e.g., #314159) and then programmatically insert a styled <div> tag with that background color into an HTML page.
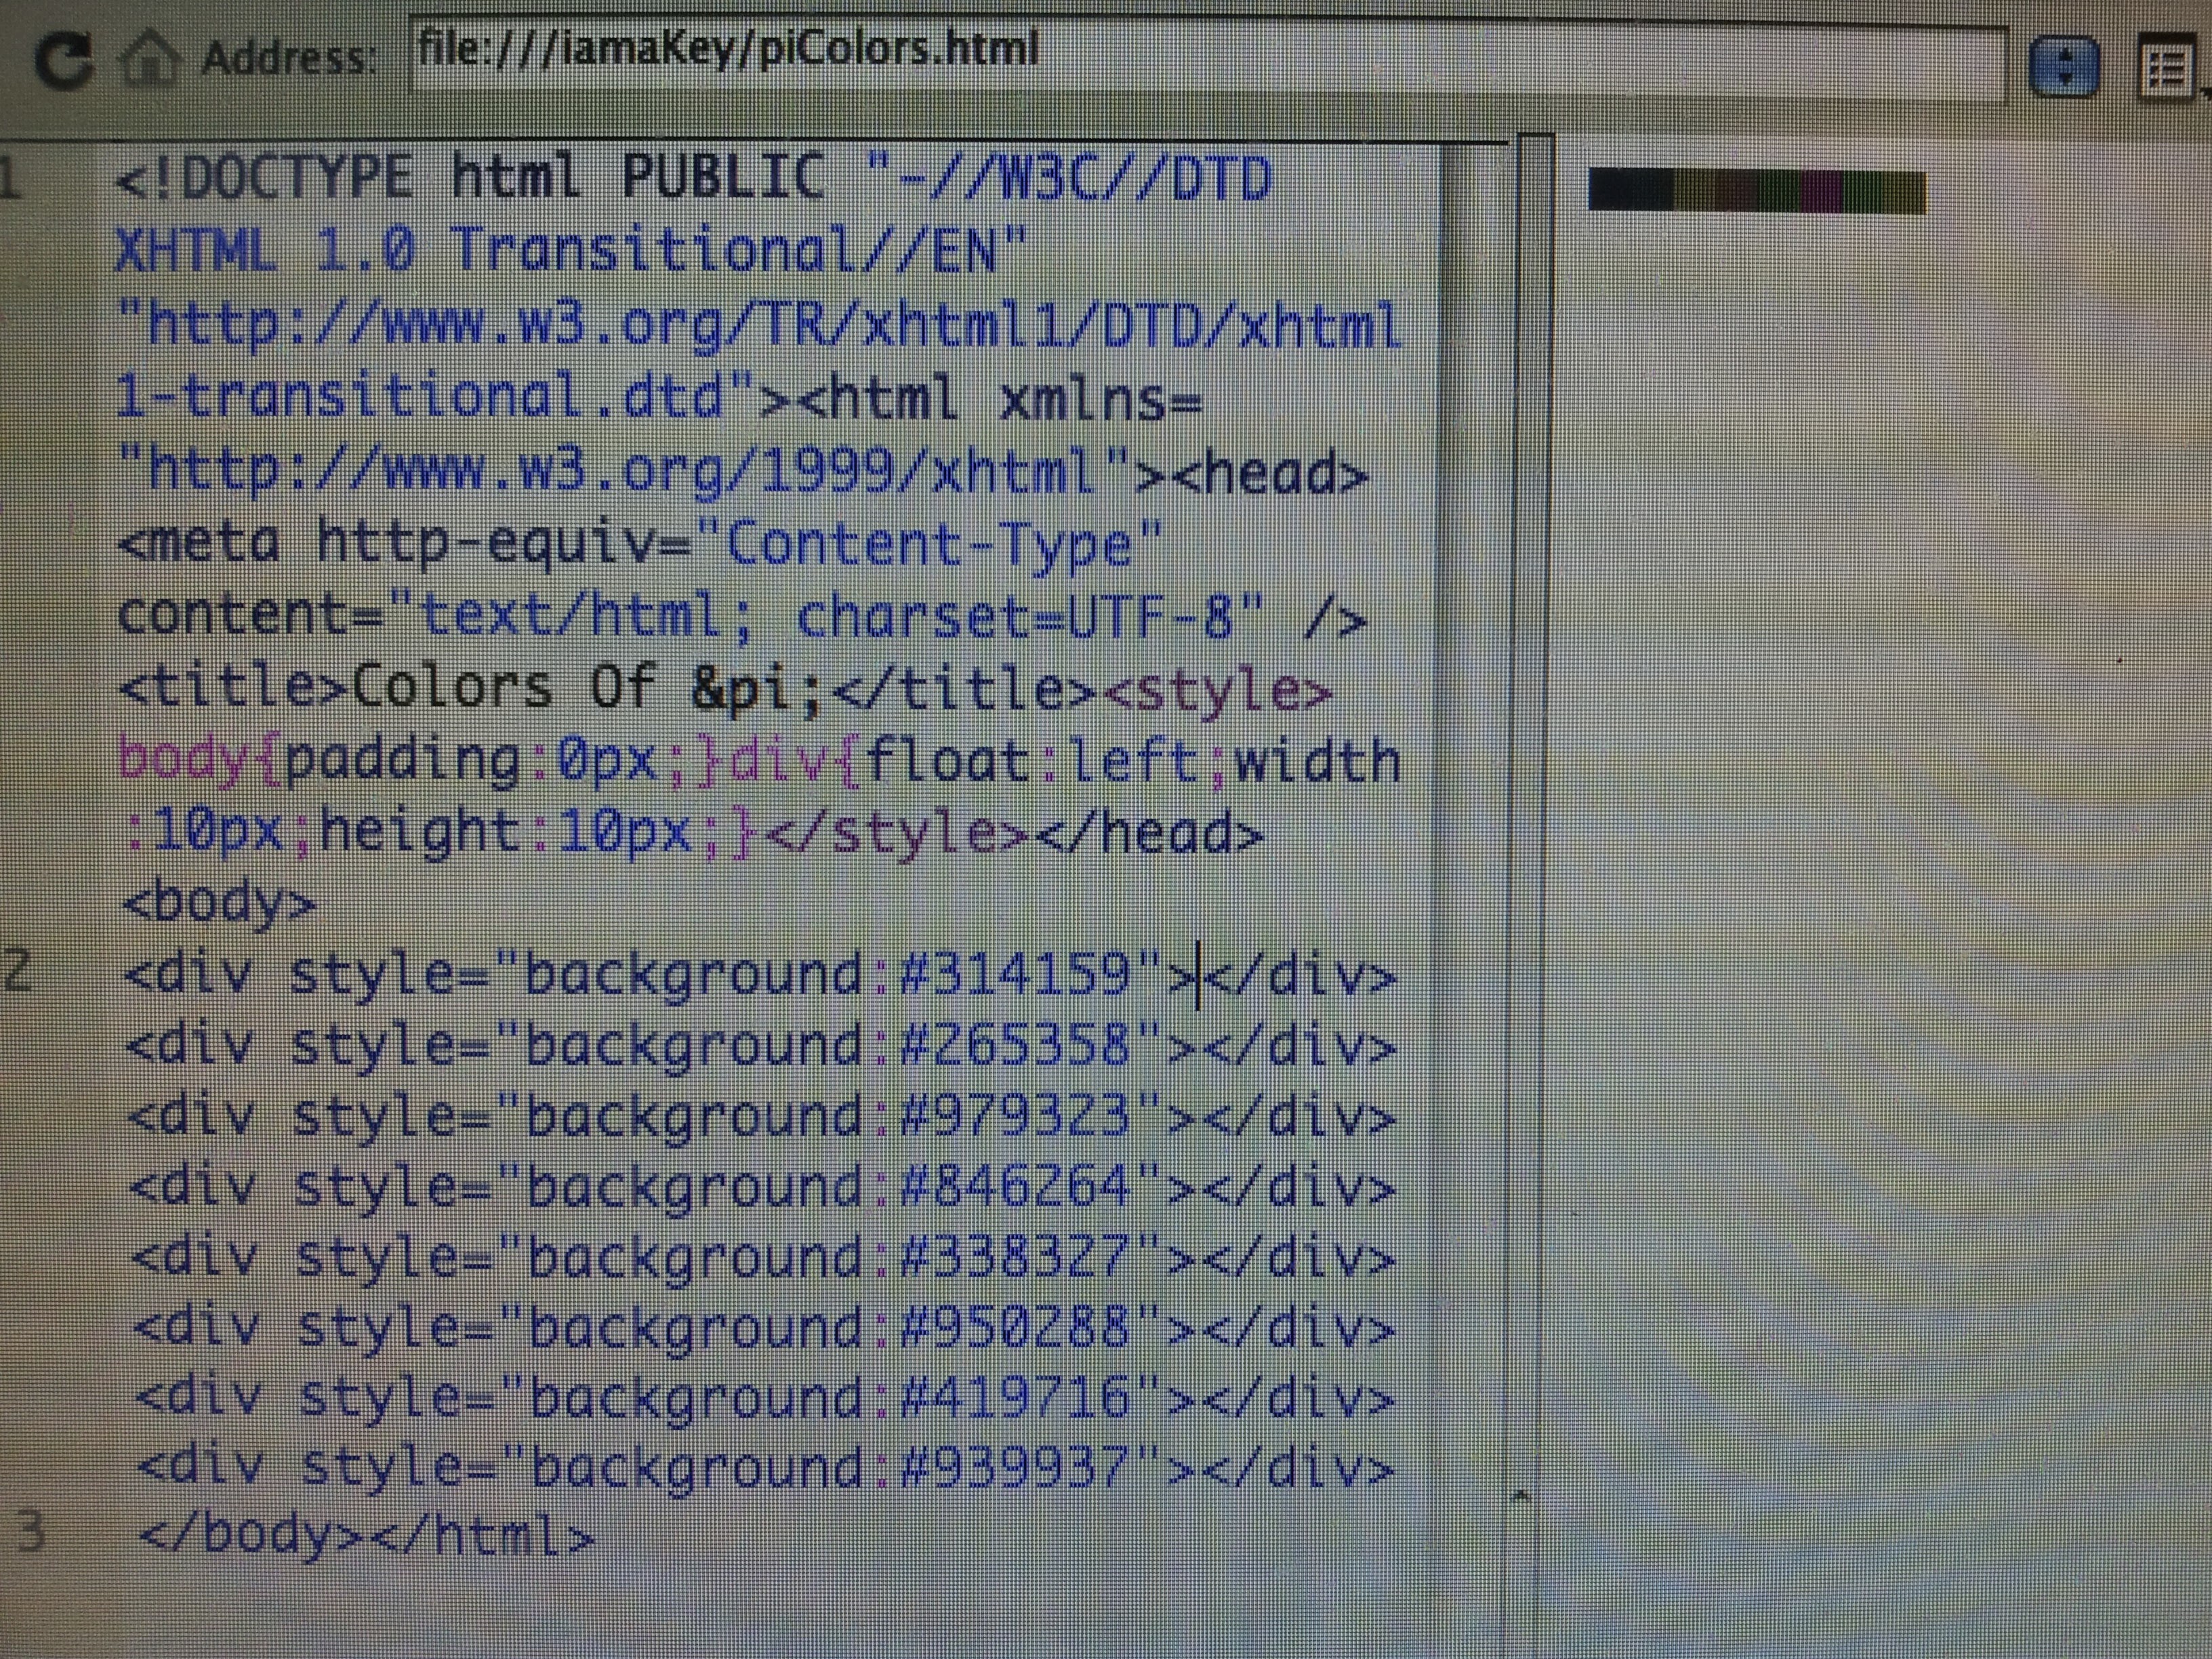
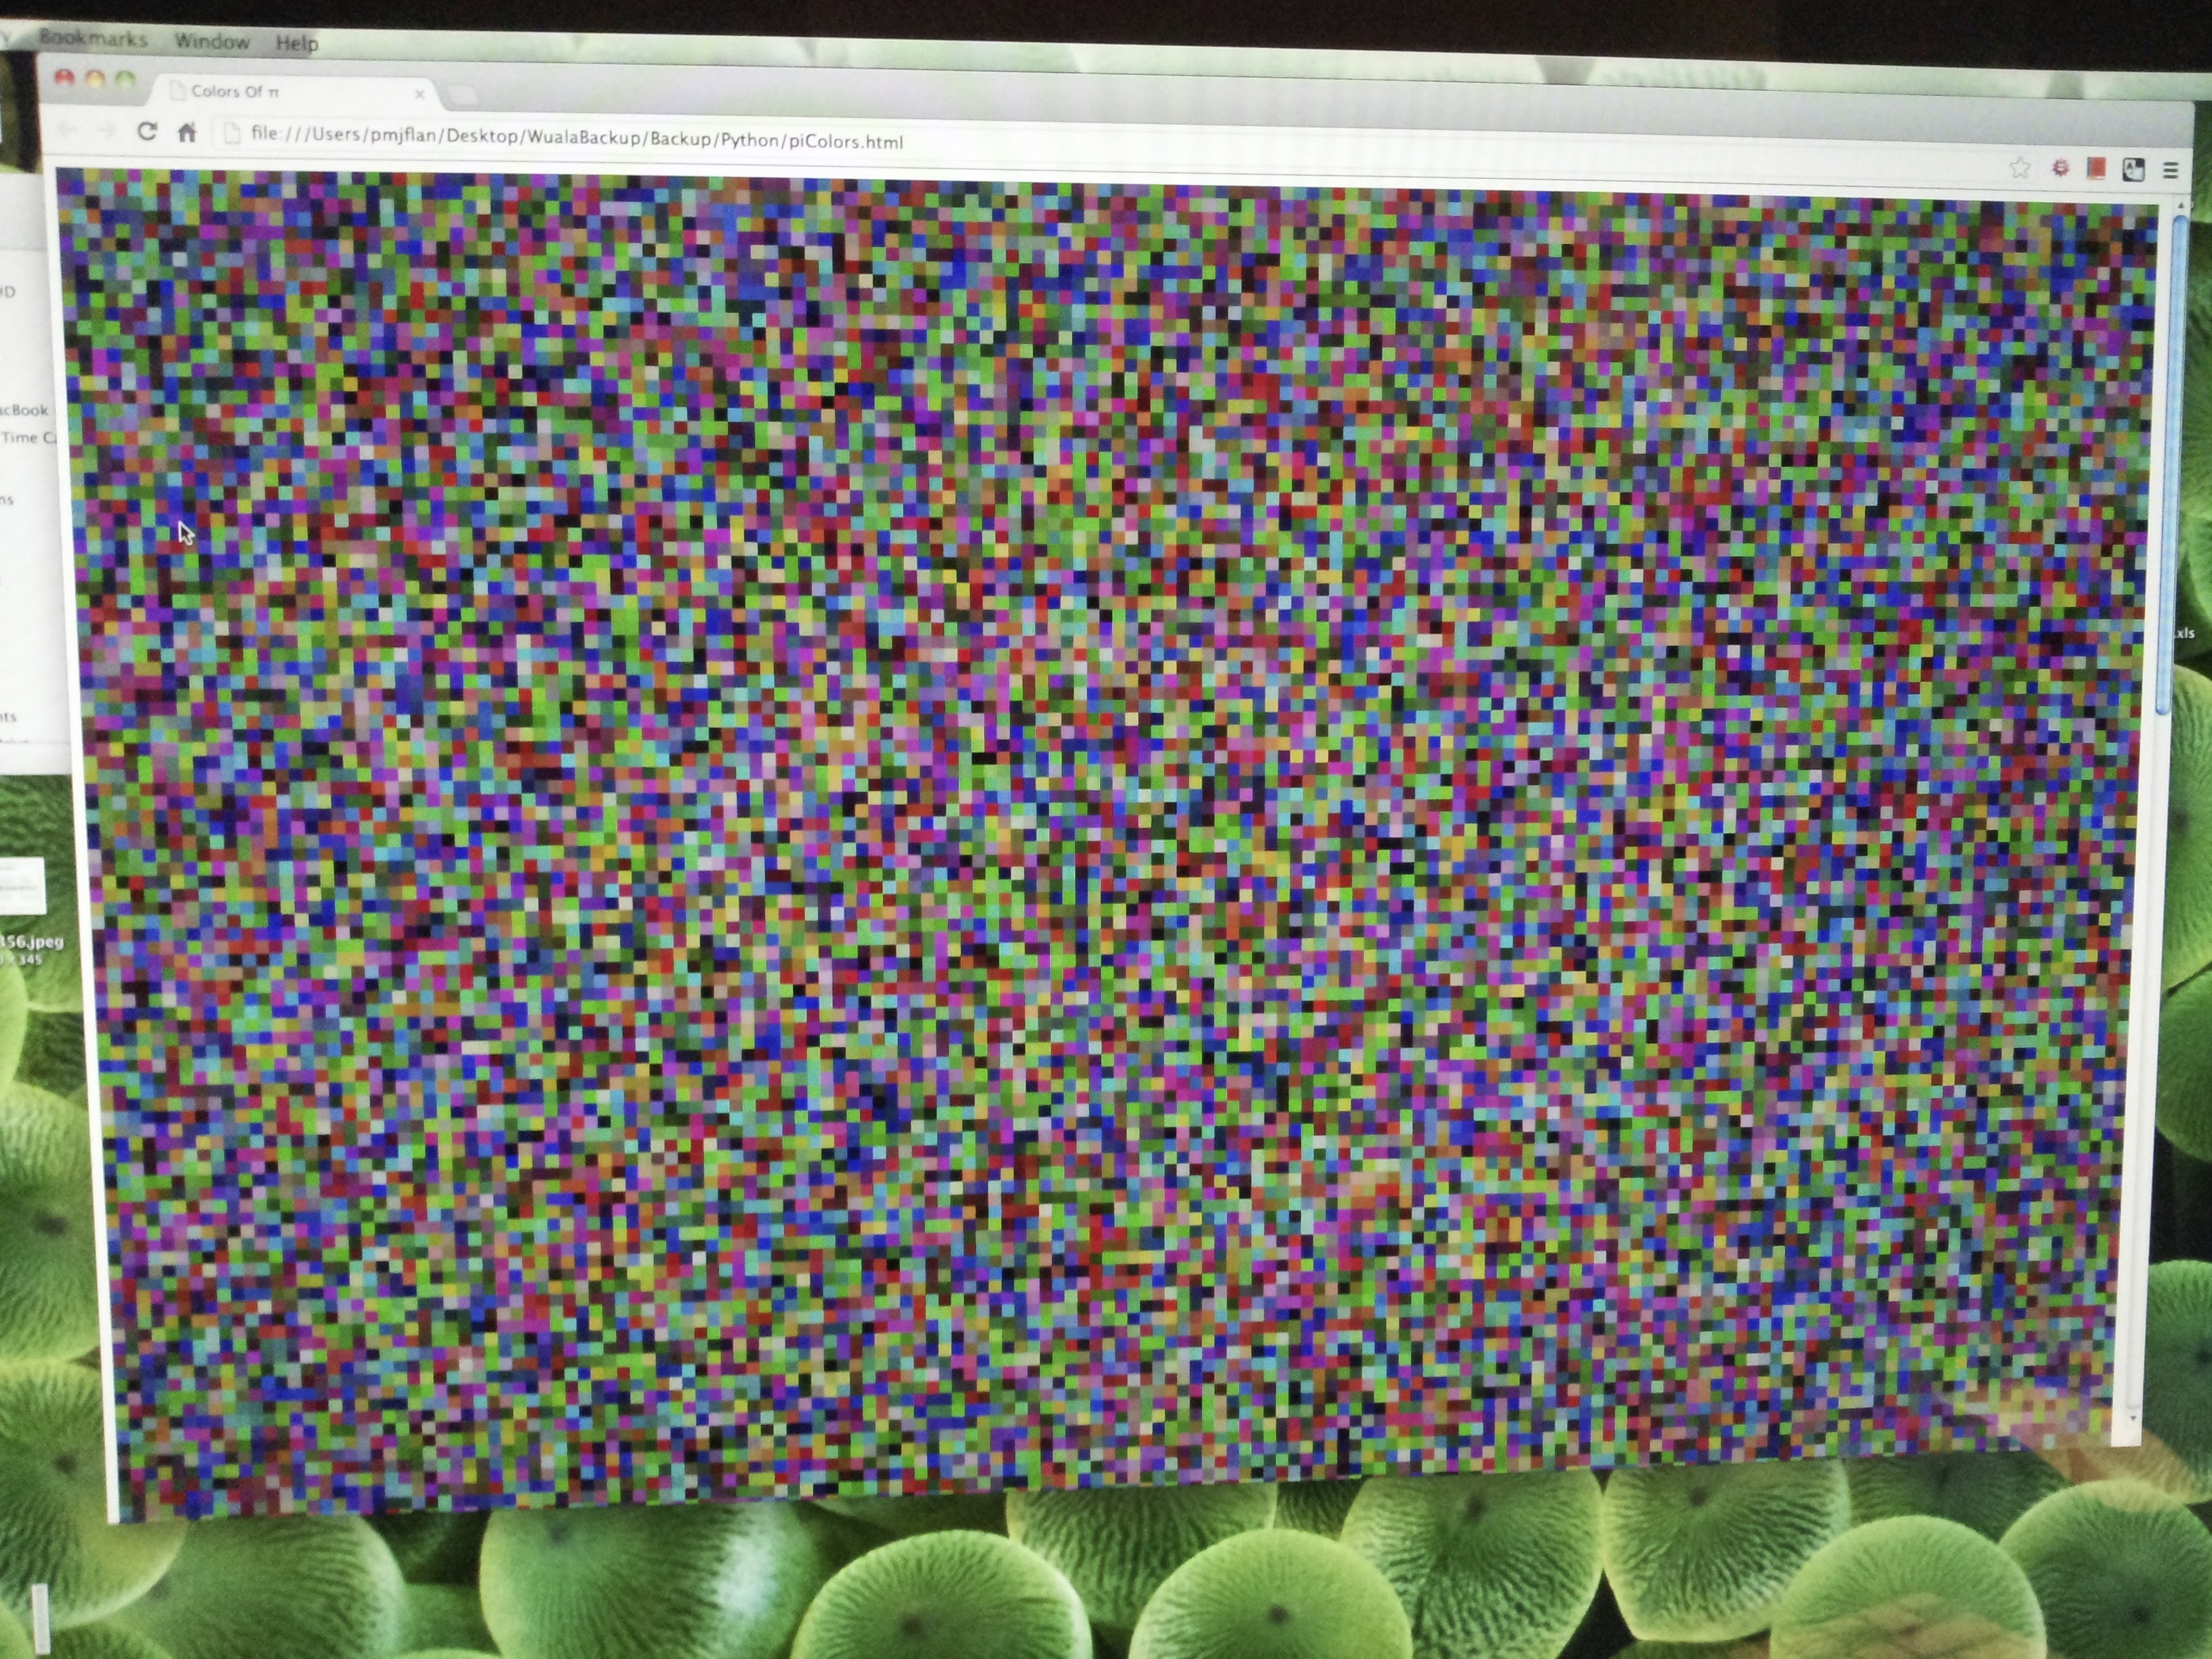
The resulting visualization was surprisingly beautiful, though it had a distinct aesthetic. Because Pi only contains digits 0-9, my hex codes were limited to those characters. This meant the colors were skewed toward the darker end of the spectrum, as I couldn’t generate any “bright” colors that required the letters A-F. The brightest possible color was #999999, giving the entire page a moody, subterranean feel.
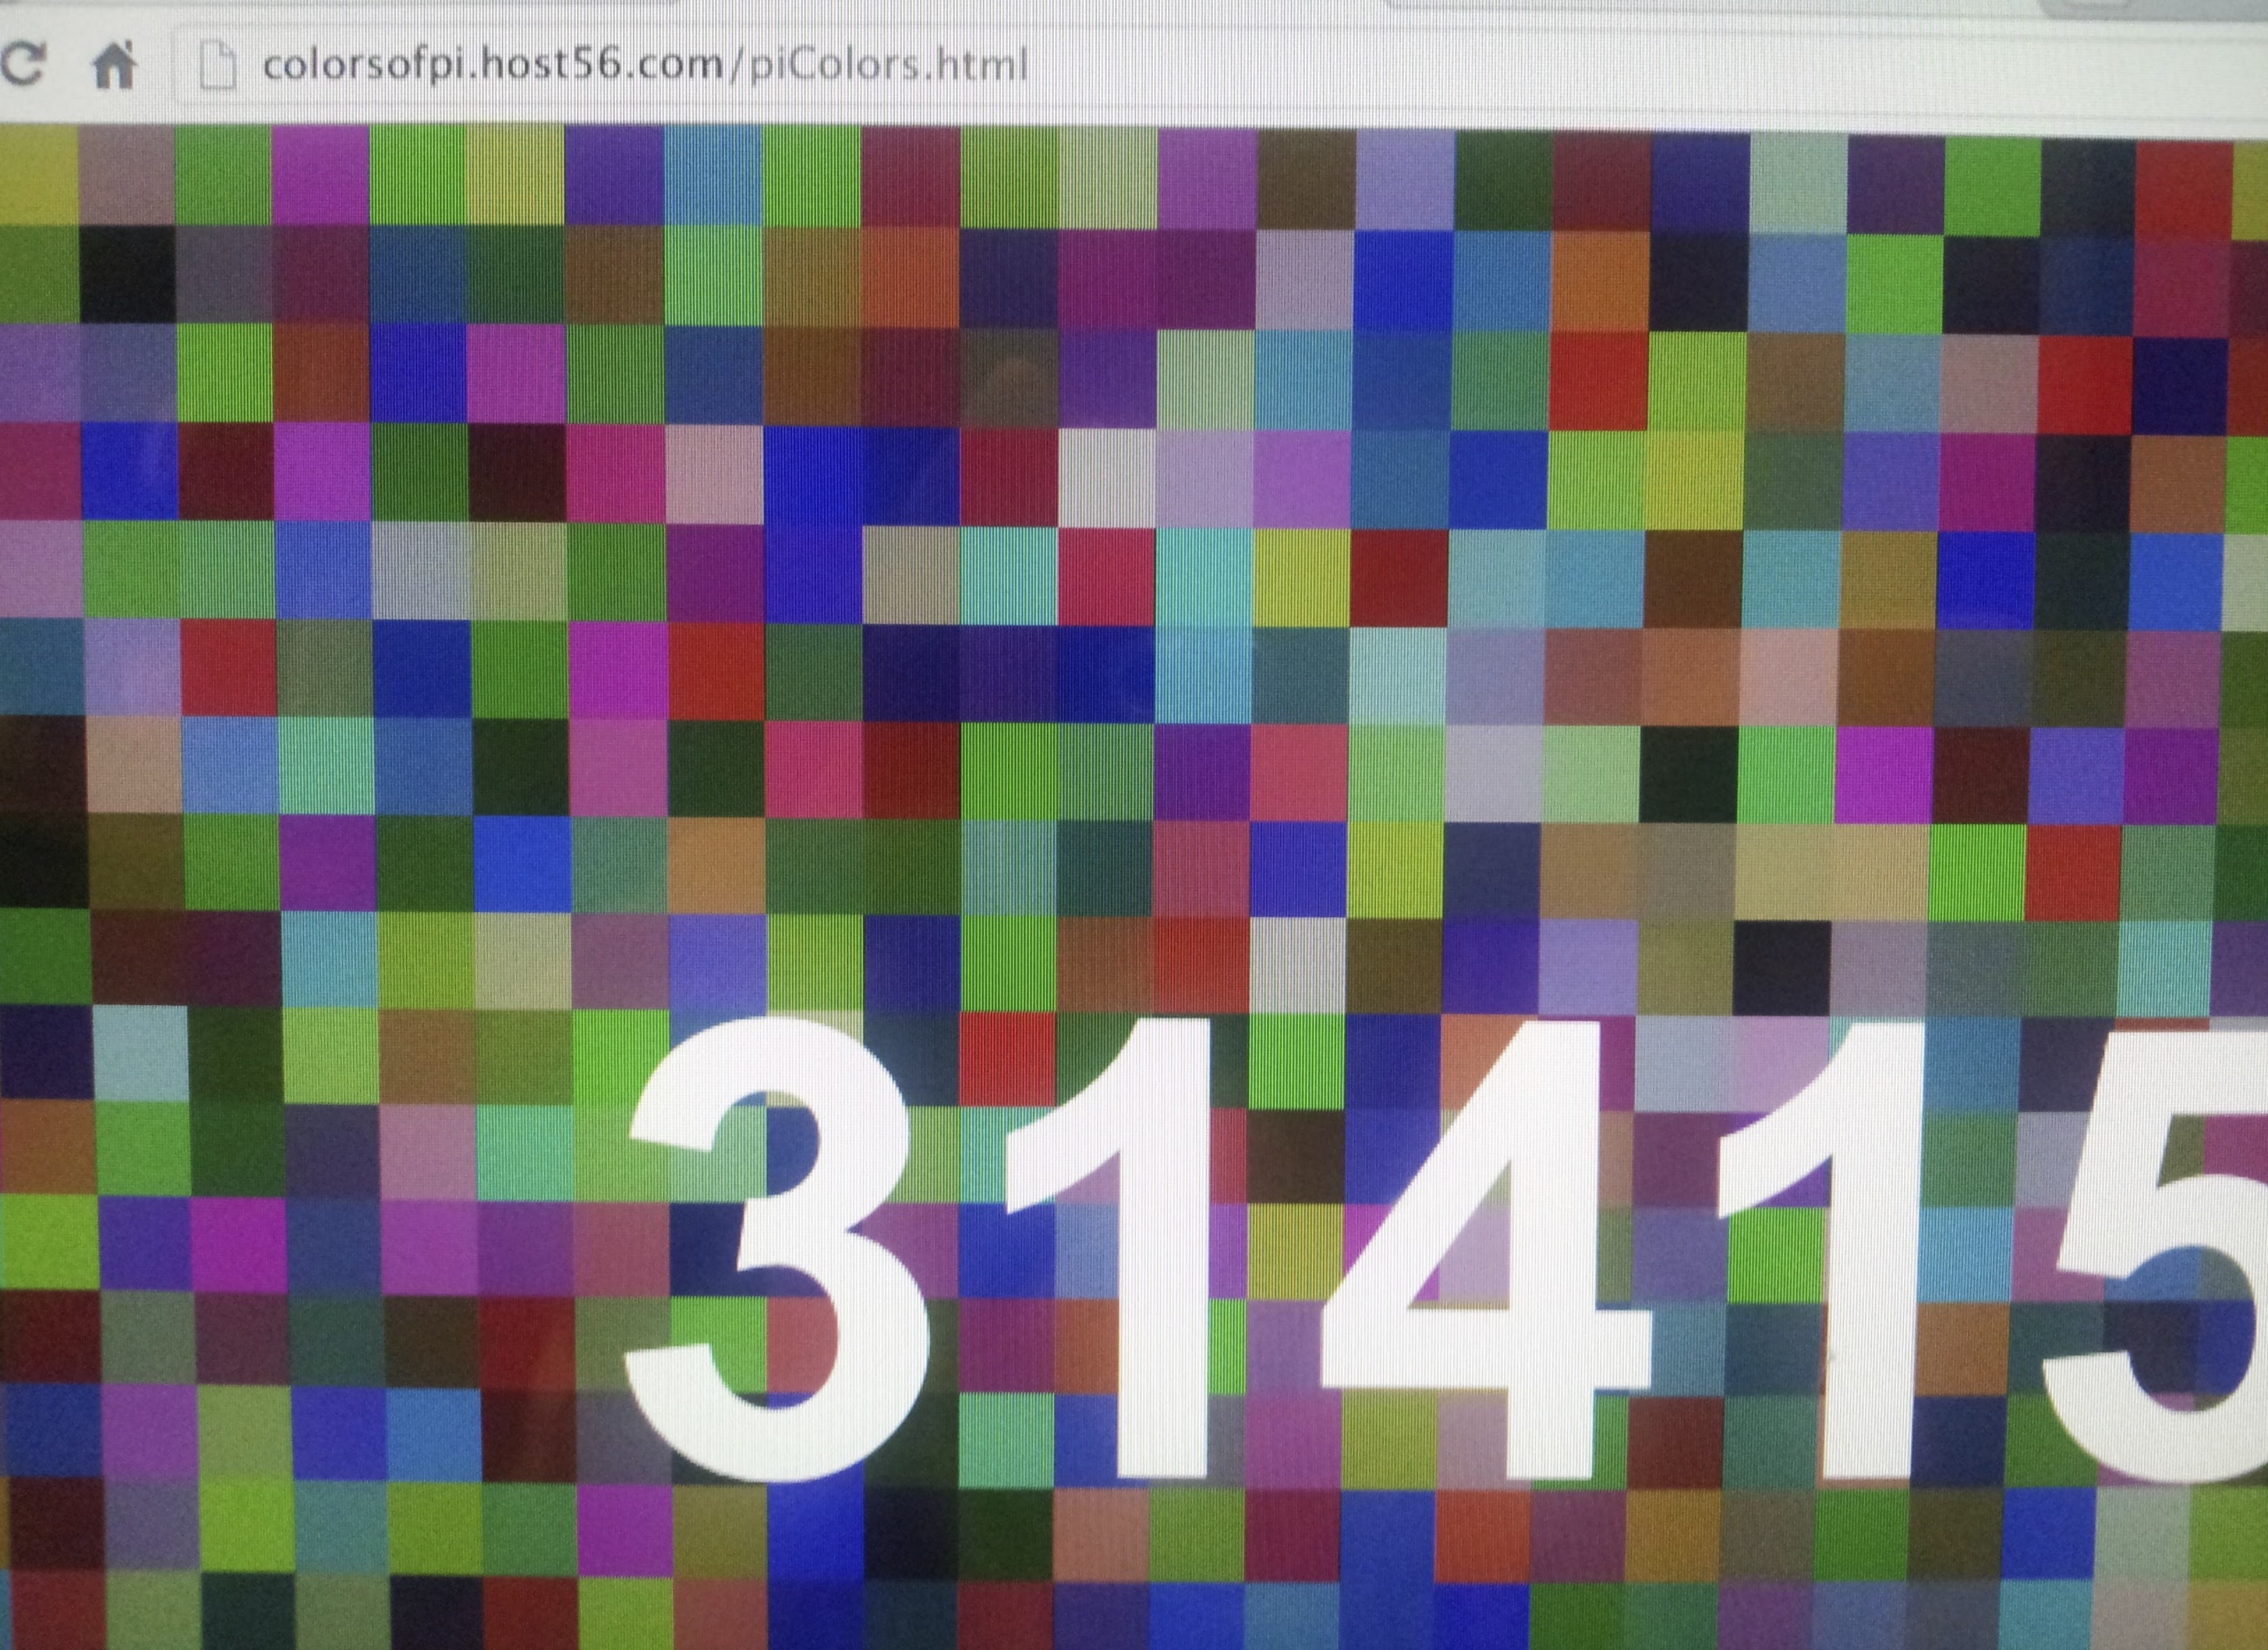
I was so thrilled with the results that I knew I had to host it online. At the time, I didn’t have much experience with web hosting, so I ended up using a free service that gave me a very untrustworthy-looking URL. Eventually, I discovered the power of GitHub Pages and moved the project there for a more permanent home.
SNL Appearance?
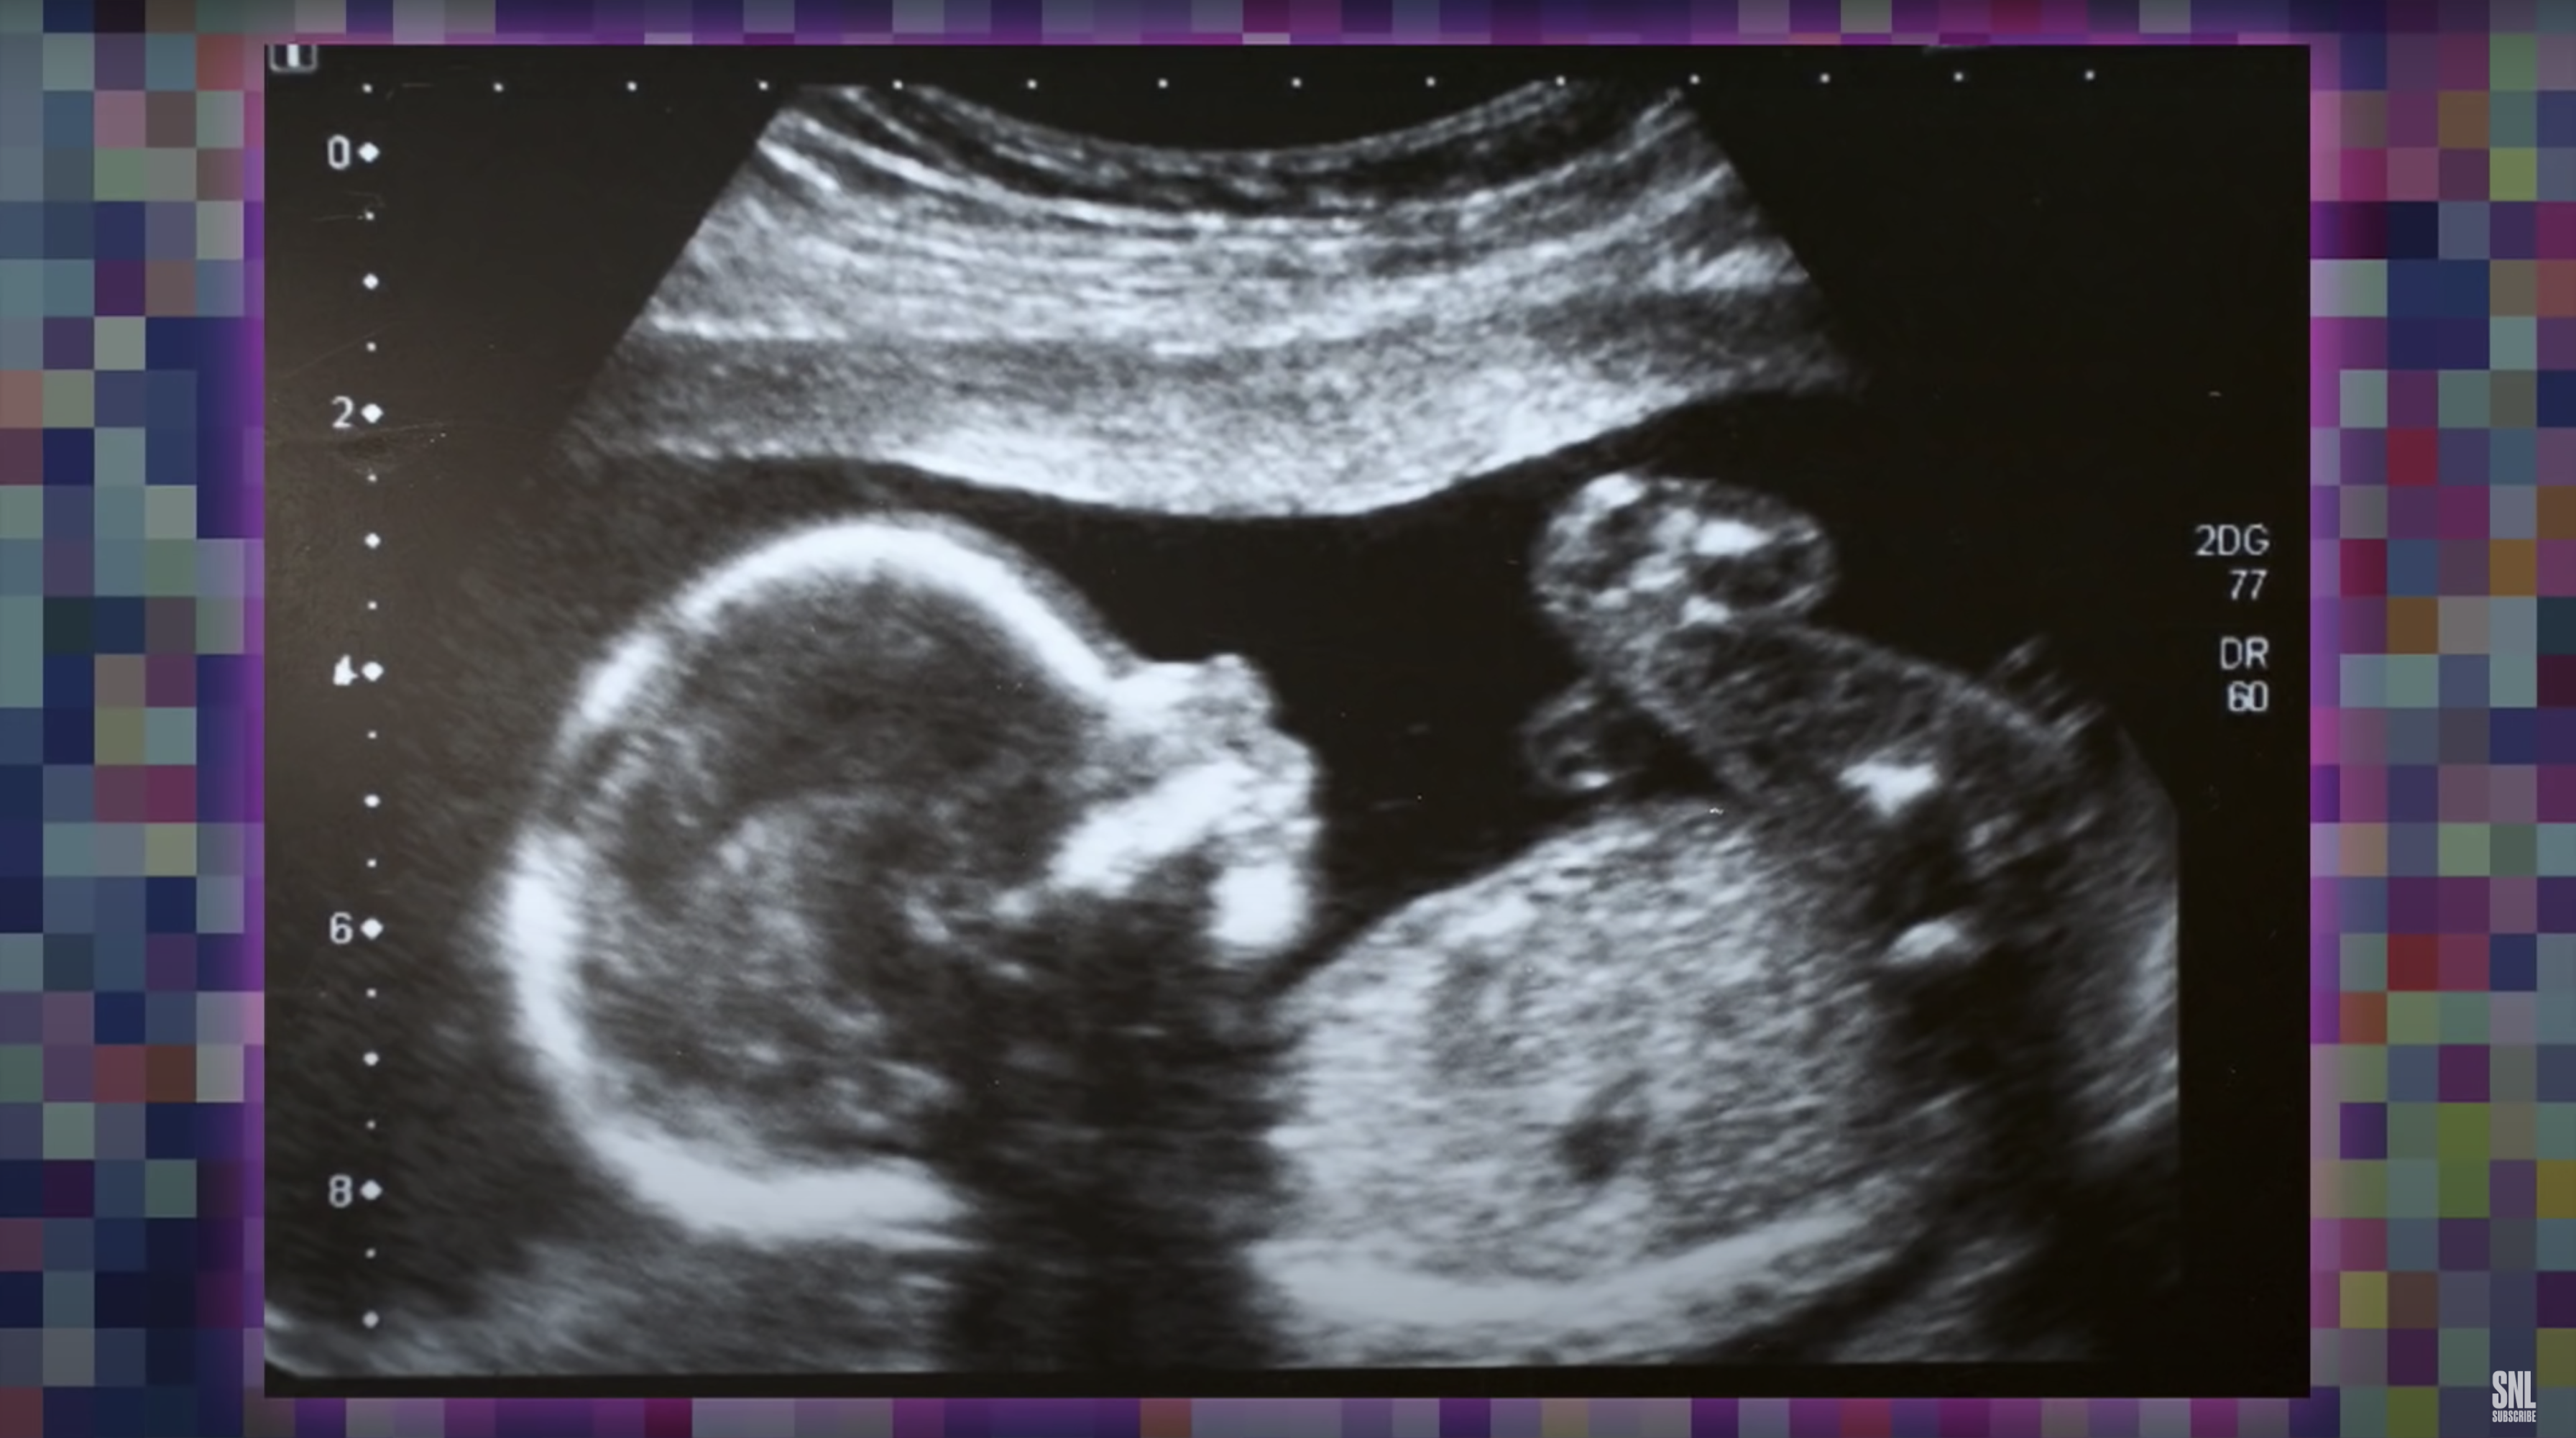
A few months after I launched the site, I was watching Saturday Night Live and was shocked to see a background that looked identical to my visualization in the “Meet Your Second Wife” sketch. While I have no way of proving it, I am absolutely convinced that someone on the SNL production team found my site screenshot it for the background of a graphic. Take a look for yourself:
Looking Ahead
Years later, I would eventually rebuild the site, moving away from the static, pre-rendered HTML approach and towards a more modern, client-side rendering method. This allowed me to expand the visualization to include millions of digits of Pi as well as other irrational numbers.